What are Server Logs?
Server log is a log where the server operations details are displayed in the chronological order. The system automatically adds details to certain files. The details include user information (including the IP-address), the browser version, the source of the user, time, etc. All this data is collected and stored in the access & error logs in case an error occurs while users visit pages.
Why Do Webmasters Need Access & Error Logs?
Before you run the server logs, it’s better to learn more about them. For example, what’s the difference between access & error logs:
- Access logs (access.log) tell us what user visited the website, when he did that and where he came from. This information is useful for the vulnerability check, especially if the website suffers from hack attacks.
- Error logs (error.log) shows errors while working with the website or using some of its features. These logs help to identify and fix the problem.
Does your website work as usual? Then you don’t need to go through logs. However, no server is immune to sudden DDoS or spam attacks. Which means, you are going to face multiple errors and problems with ranking the website by search engines. And it is now when system administrators and SEO specialists usually step up. Logs help them to analyze and understand the situation.
Run Access & Error Logs
Sometimes, the hosting provider deactivates the logging feature to save the disk space. Let’s learn how to run access logs and use Beget hosting as an example:
- Open the website. Find the Logs/Access Logs (access.log) section in the console. Do the same for the error log (error.log).
- Select the website (in case you have several of them) you need logs for.
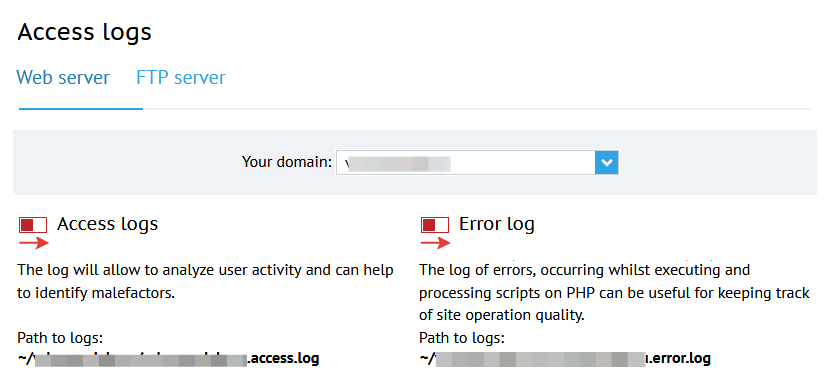
- Pay attention to the two columns: Access Logs and Error Logs. There are red icons next to these names. Those icons are toggle switches (they switch between the active and inactive modes).
 4. Click on each item, and the red icon turns green. That means the logs have been activated. At the same time, you’ll see the path to the folders where the log files are stored.
![]()
If you can’t activate the logging request function contact the hosting user support. Perhaps, this feature was disabled.
The files access.log and error.log have the same type. The only difference is that the first one monitors user activity on the website, while the second one records all errors that occur on the website. So there is no point in writing a separate chapter on error logs. The same formula works here: 1 line = 1 error. That’s how it’s easier to understand the type of the error, where it leads to, and what category of users suffers from it.
Where to Find Server Logs
Your Hosting Provider is Beget
Once you activate the logs on the server, you are going to see recent information, starting from the moment when the logs were run (see the chapter above). In our case, the logs are stored on the hosting here:
/mysite.com/public_html/access.log,

/mysite.com/public_html/error.log
You can “read” the logs in a text editor. Keep in mind, that each line in the document equals one access request. Log files can be located in the Logs section on the hosting console.
Your Website is Stored on a Virtual Server
If you use your own virtual server, then access.log and error.log files can be found in the following folders:
RHEL / Red Hat / CentOS / Fedora Linux log file location –
/var/log/httpd/

Debian / Ubuntu Linux log file location –
/var/log/apache2/
/var/log/nginx/

FreeBSD log file location –
/var/log/httpd-access.log
The folder name depends on the operating system on the server.
Your Hoster Uses cPanel
Some hosters use the out-of-box solution called cPanel as a control panel. This means that the differences between the panels are only visual. Let’s see how to find server logs in a different interface.
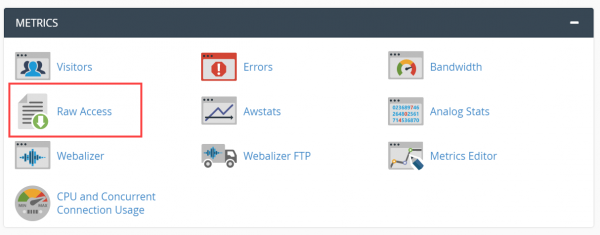
Open cPanel and pay attention to the Metrics menu. There you see tools for analytics and troubleshooting. Open Raw Access (Access Logs).

Access logs show who visited your website.

By default, log files are archived in the home directory on your server every 24 hours. By the end of the month, they are removed from the directory to optimize disk space.
cPanel provides you with the ability to download an archive with log files. Just click on any link with the domain name (highlighted in blue).
Study Server Logs
Let’s analyze the content of the server log and figure out what each value means:
sitename.com 78.12.93.184 - - [23/Jan/2018:07:40:13 +0100] "GET /page/4/ HTTP/1.0" 200 66254 "-" "Ahrefs Bot (https://www.aaaa.com/bot;
)"
- sitename.com – the website URL;
- 78.12.93.184 – the user’s IP-address, followed by the date & time of the visit, and the user’s time zone;
- GET – the request to get data. There may be another POST request to send data (for example, the website authorization);
- page / 4 / – go to the page #4;
- HTTP / 2.0 – user protocol used to open the website;
- 200 – the response code received by the users from the server;
- 66254 – how many bytes have been sent to the user;
- Ahrefs Bot (https://www.aaaa.com/bot; bot@bbbb.com) – the visitor data (user/bot); the source of the visitor; his operating system.
We went through the simple example – one of the many structures alike. This means that it can be quite tricky to understand everything. That’s why various information analyzers have been created (WebAlyzer; Webtrends; Awstats). They help to organize and decrypt the content of the log files.
One of the programs can be installed on hosting as well. For example, you will be offered to use AWStats on Beget. Click on the Install button.

Perhaps, studying logs on the website will help you to find a vulnerability or determine potentially dangerous IP-address.
Conclusion
Checking access & error logs is one of the many ways of finding vulnerabilities and sources of the errors. It’s particularly useful if, for some unknown reason, your server experiences overloads, and you need to fix it. We’ve told you how to run the access & error logs on the hosting with different control panels or a virtual server.
